


- From "Being Visible" to "Being Clearly Understandable" - The Second Evolution of DCS Flowchart Design
In the control room of the sulfuric acid production plant, the flow chart serves as a bridge between the operators and the production site. Last year, we launched the first version of the DCS flow chart renovation, which achieved initial customer approval with a minimalist style and clear layout. However, as we engaged in deeper communication with the customers, we discovered that merely "being visible" is not enough; it also needs to be "clearly visible" - the information hierarchy should be more distinct, the picture texture should be more realistic, and the operation path should be shorter. Thus, the second version of the DCS flow chart emerged, which is not a simple patch-up but makes the picture more three-dimensional, more integrated, and more understanding of you.
01 Design Concept Upgrade
The design concept of the first version was "simple yet not simplistic", with a dominant gray tone to reduce visual load. This concept was inherited in the second version, but we injected a stronger sense of reality - in the drawing of devices, we adopted more textured three-dimensional shapes.
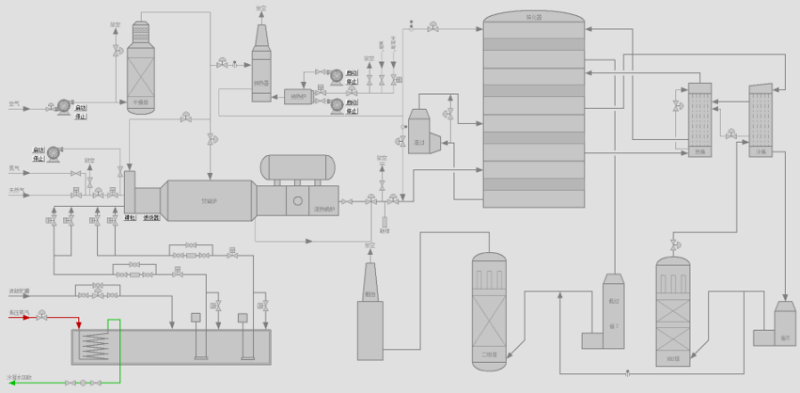
Figure 1
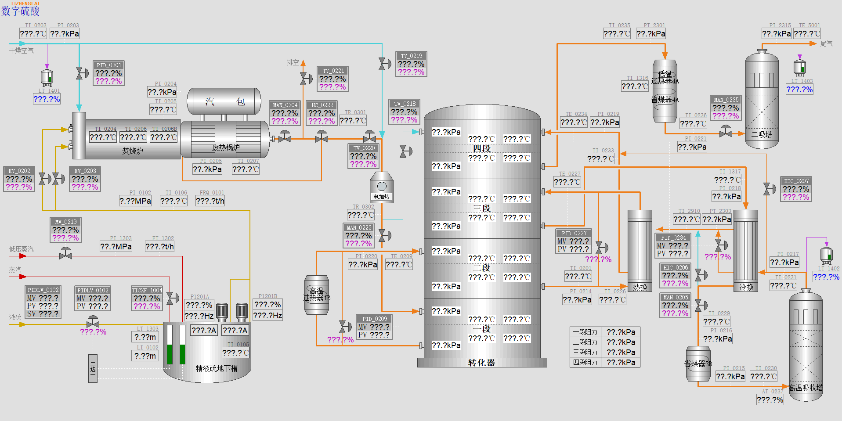
Figure 2
Figure: Figure 1 shows the old flat style, and Figure 2 shows the new three-dimensional style. By comparing the two interface versions, the upgraded parts are clearly visible.
The old equipment mostly had flat, simple line outlines; the new version adopted a more textured three-dimensional design, such as converters and storage tanks with shadows and highlights, allowing operators to quickly identify the type of equipment and view the interface more clearly and intuitively.
The integrated flowchart is also an indispensable part. For example, in this interface, the liquid sulfur part was integrated into the main sulfur combustion conversion interface, forming a complete process chain from feedstock to steam production. The number of drawings was reduced, and the density of core information increased. This effect also added data frame display, allowing for a clear view of the final display effect.
02 Color System Upgrade
Color is the most intuitive information carrier in the flowchart. Based on the first version, we have comprehensively optimized the color system, making it both recognizable and not causing visual burden.
Smoke gas - Orange Steam - Red Water line - Green Acid line - Purple Air - Blue
This classification method enables operators to quickly determine the medium type by scanning the pipeline color, significantly reducing the time for search and confirmation.
We continued the "black for normal, yellow for warning, red for alarm and flashing" color logic. In the new version, we differentiated the visual weight of data frames according to customer needs - using different color fonts to represent different types of variables, forming clear information separation. (See Figure 03)
03 Interaction Experience Upgrade
In the old version of the flowchart, when operators switched between some screens, they needed to operate through the top menu. In the new version, a navigation bar was added, integrating the main sections and interlocks in the bottom navigation bar.
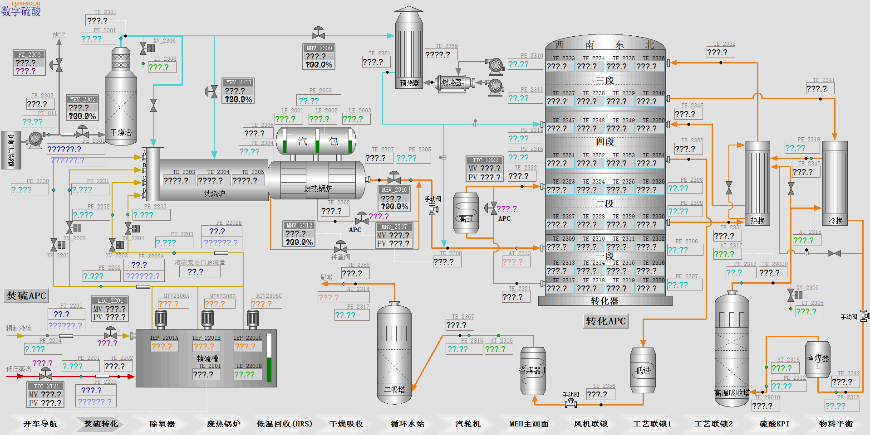
Figure 3: The bottom navigation bar enables one-click navigation between workstations, and the quick toolbar at the bottom enhances operational efficiency.
Fixed floating: The navigation bar remains visible regardless of where the screen is scrolled to.
One-click jump: Clicking on any workstation name directly switches to the corresponding flowchart.
Current highlight: The workstation being viewed is highlighted in the navigation bar, clearly indicating the current location.
04 Personalized customization
Each sulfuric acid plant has different process flows, equipment configurations, and operational habits. We offer personalized customization services, specifically drawing based on each customer's needs.
1. Based on the actual device configuration of the customer, decide which equipment, pipelines, and instruments should be included in the flowchart.
2. Customers can adjust the overall color scheme, equipment colors, font styles, etc., according to their preferences or enterprise norms.
3. Parameters that need to be displayed, their positions, and the precision of display can all be adjusted. We will have in-depth communication with the customer's technical personnel at the project's initial stage to carry out targeted design.
05 Conclusion
From the first version to the second version, the changes are not just in the visual effect. By reducing the number of drawings, adding a sense of three-dimensionality and a color system, and adding a bottom navigation bar, all upgrades are centered around the same goal - to make each set of flowcharts more in line with the actual usage habits of the customers.
An excellent DCS flowchart is not only a control interface, but also the expression of the process, the improvement of efficiency, and the guarantee of operation. In the future, we will continue to deeply focus on the sulfuric acid industry, continuously iterate and optimize based on the needs of each customer, making the flowcharts not only "visible" but also "clear".